A diagram showing different kinds of bicycles and their ability to transport heavy loads

Mobility is one of the basic needs of urban dwellers. We often hear prejudices about city transport: that cycling is impossible in hilly cities, that building a good transit system costs too much, and so on.

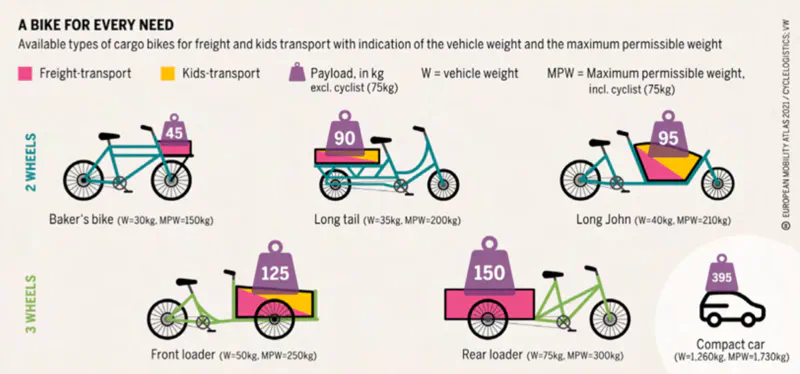
The numbers, however, tell a different story. Consider these facts: bikes weigh around 14 kg on average, while cars weigh several tonnes. The infrastructure damage caused by bicycles is negligible compared to that caused by cars, meaning repairs are needed far less often. Bikes are also cheaper to buy, and riding one costs far less than filling a car with petrol. The environmental footprint of a bicycle is minimal compared to a car – a bike requires only the energy and materials used in its production, while cars consume far more energy both during manufacturing and everyday use. The same holds true when both reach the end of their life and become waste.

Infographic showing three transportation options (car, moped or bus, and e-bike) with their respective CO2 emissions: 7,000kg, 2,500kg, and 300kg for a 15,000-mile journey.

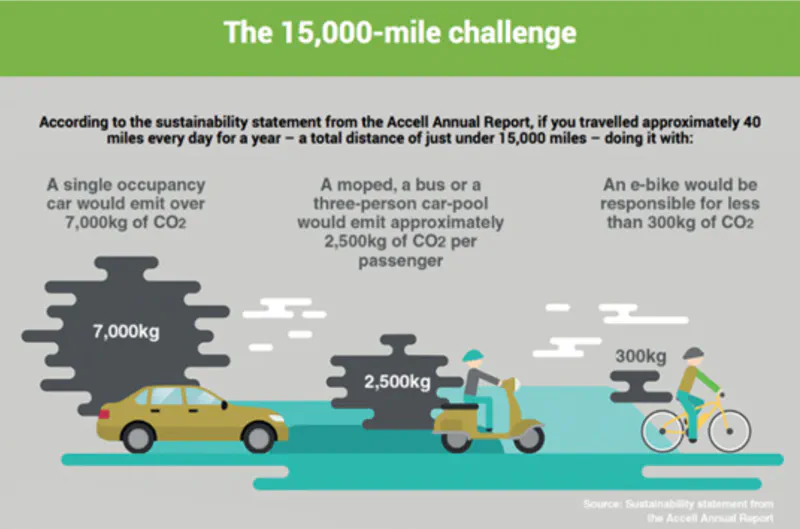
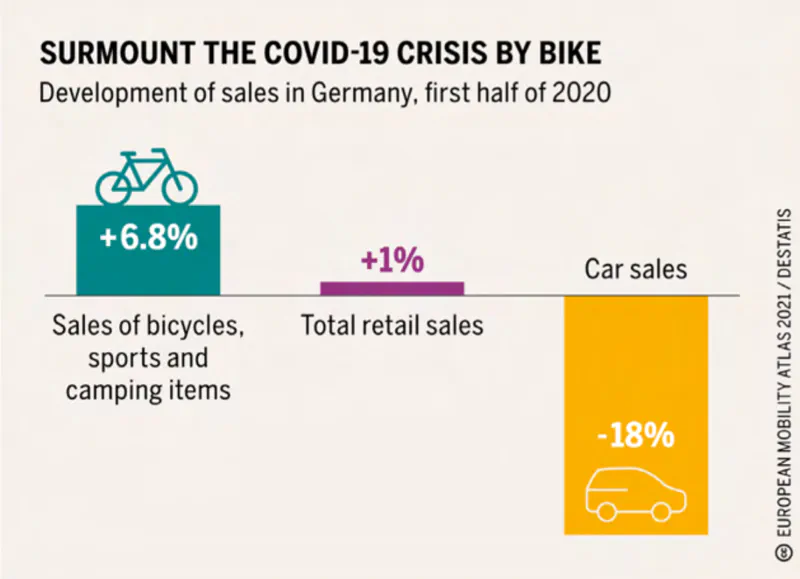
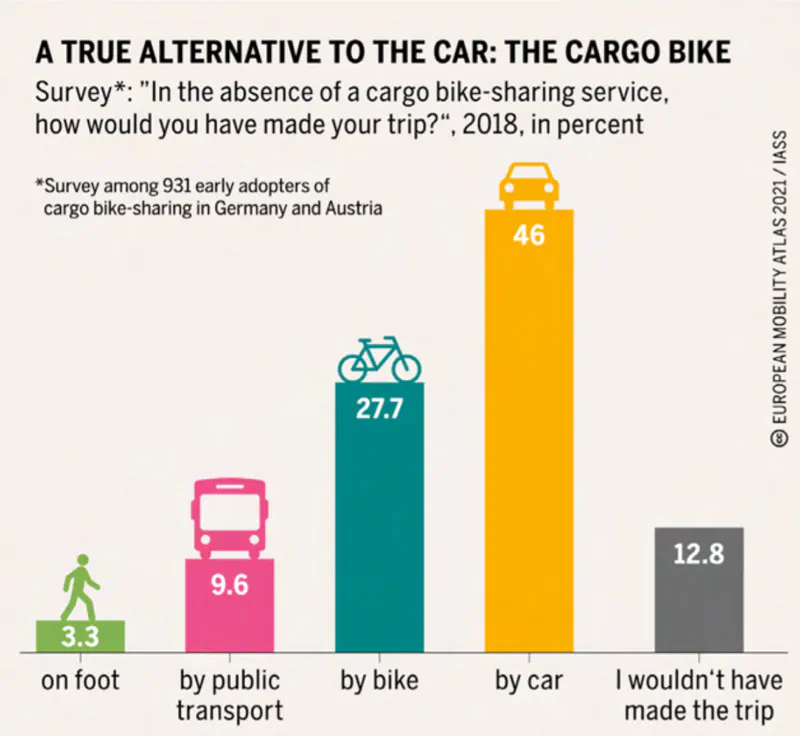
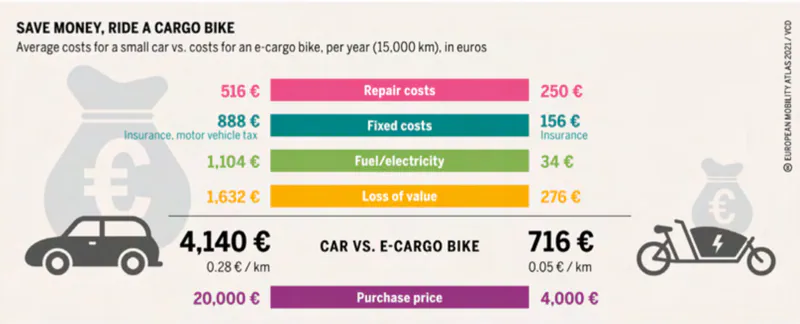
Step outside and watch the traffic, and you will quickly notice that most cars carry just one person per journey. This makes cars remarkably inefficient in terms of both fuel consumption and the space they occupy in the city. Electric bicycles are not as eco-friendly as regular ones due to their lithium batteries, but they are still far better than cars. Electric cars are an improvement over fossil-fuel-powered ones, but they bring their own problem – they take up just as much space as conventional cars. Here is some data from the Mobility Atlas on cycling across the EU:

Illustration showing how bicycle sales were up, and car sales down, in 2020
Statistics showing that cargo bike users use them to replace car trips
Infographic showing the cost savings of cargo bikes versus cars

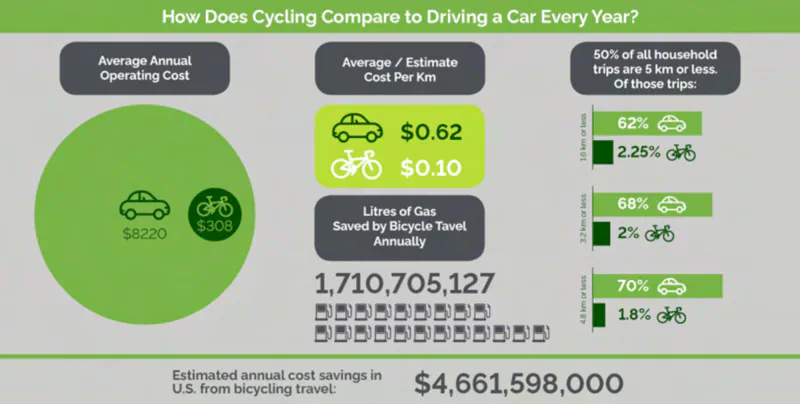
Now take a look at this infographic comparing bike and car usage statistics in the USA:

Infographic showing cost savings of using a bicycle instead of a car in the USA

Want to try a quick experiment? Head outside during rush hour and watch the cars go by. Count how many carry more than one person. Now picture all those people travelling by public transport or bicycle instead. How much space would open up? What could that space become?

Many people assume that building public transport infrastructure is prohibitively expensive – and in some cases, such as metro construction, it can be. But cities do not have to start there. Adding protected bike lanes separated by parked cars or other low-impact barriers, and expanding bus services to underserved areas, are practical first steps. When you factor in the full costs of cars – fuel, infrastructure, and the wider social and health consequences – it becomes clear that investing in cycling and public transport infrastructure is the smarter choice for cities that want fast, clean, and affordable mobility.

Street diagram showing a typical car-dominated road layout with multiple car lanes
The norm (often with more car lanes)
Diagram of a bike lane squeezed between parked cars and moving traffic, showing an unsafe design
Bad planning: the bike lane is only on one side, squeezed between car parking and car lanes
Illustration of a wide, protected bike lane separated from traffic by a physical barrier
Good planning: bike lanes are wide and protected from traffic
Diagram showing cyclists routed through the middle of the street, highlighting poor routing
Bad planning: bikes are routed through the middle of the street
Street diagram with bike lanes running along the sides, separated from vehicle lanes
Good planning: bike lanes run along the sides
Intersection diagram showing missing pedestrian crossings on some sides, creating unsafe gaps
Bad planning: not all sides of the street connect at crossings
Intersection diagram showing pedestrian crossings on all sides for continuous, safe routes
Good planning: all sides connect at crossings
Another intersection example showing incomplete pedestrian crossings on some sides
Bad planning: not all sides of the street connect at crossings
Intersection example with crossings on all sides and connected pedestrian routes
Good planning: all sides connect at crossings
Diagram showing an intersection where not all crossing directions are accommodated for pedestrians
Bad planning: not all sides of the street connect at crossings
Diagram showing fully connected crossings on every side for safe pedestrian movement
Good planning: all sides connect at crossings
Diagram where tram tracks are sandwiched between car lanes and parked cars, creating conflicts
Bad planning: trams are sandwiched between car lanes and car parking
Diagram showing tram lines routed through the centre of the street with dedicated space
Good planning: trams run through the centre
Crossing without pedestrian islands and incomplete crossings, forcing pedestrians across wide lanes
Bad planning: no pedestrian islands and not all sides connect at crossings
Intersection with pedestrian islands and crossings on all sides for safer crossings
Good planning: pedestrian islands and crossings on all sides

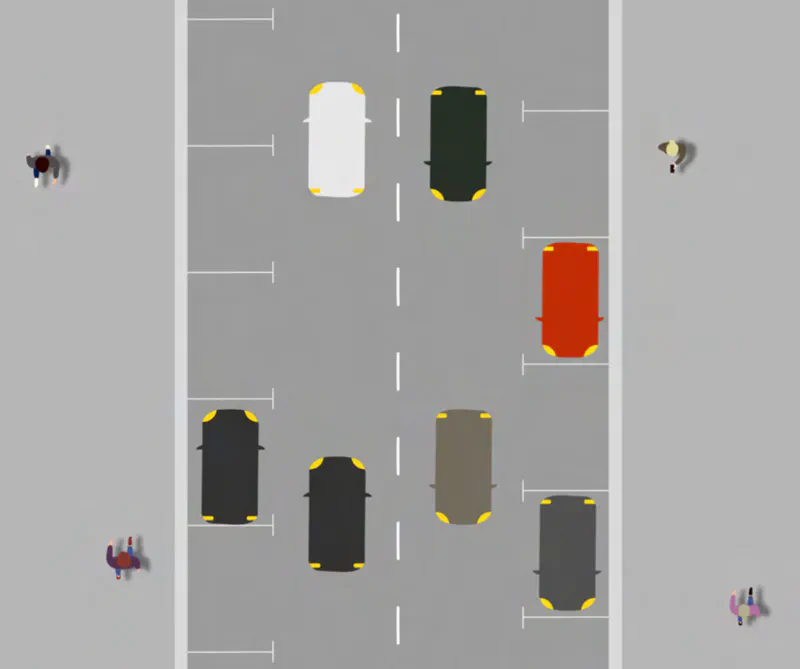
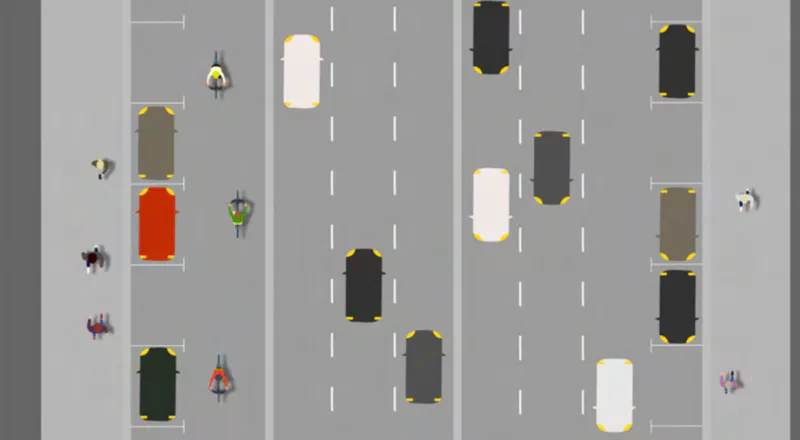
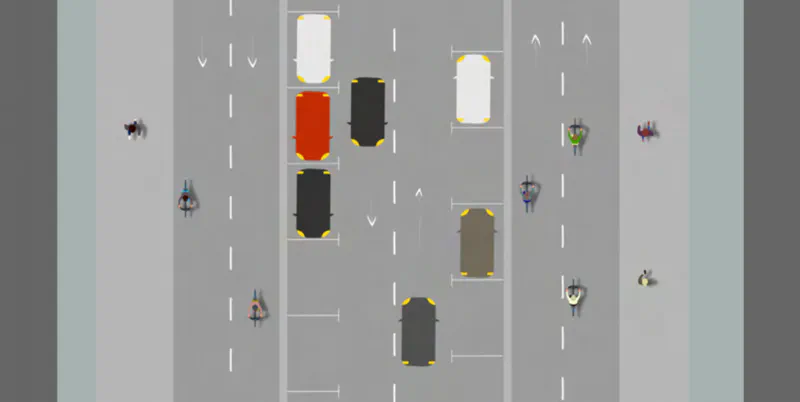
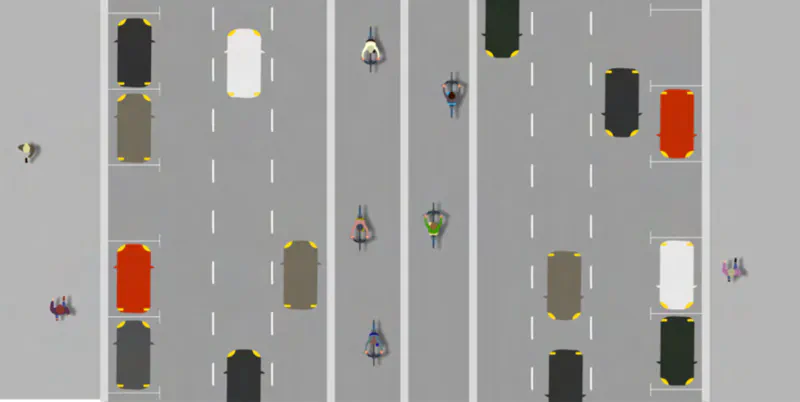
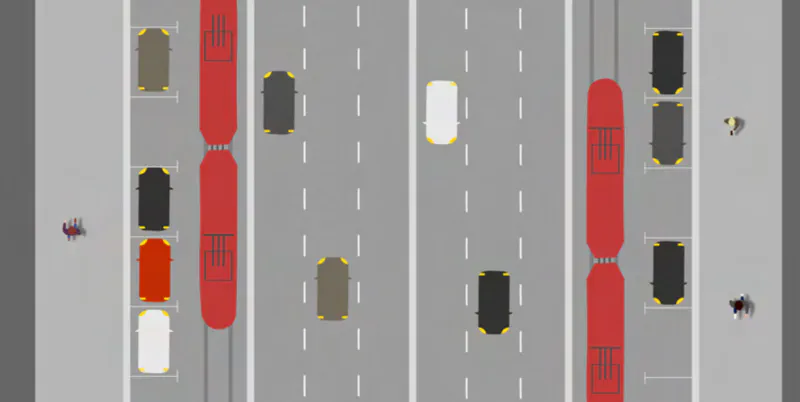
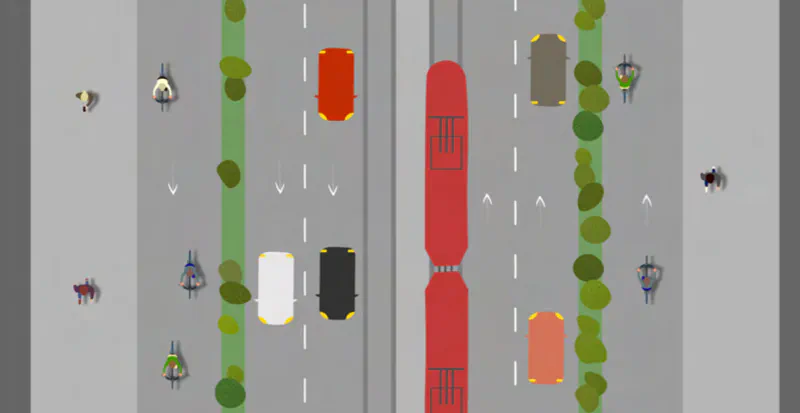
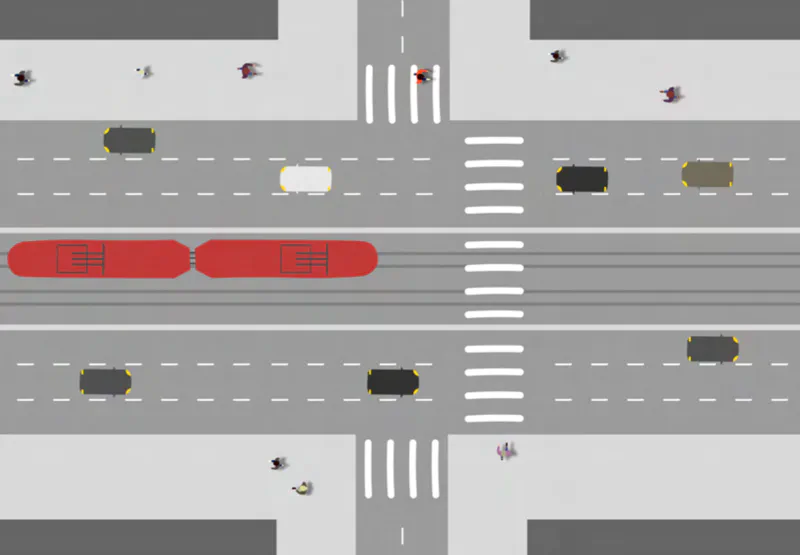
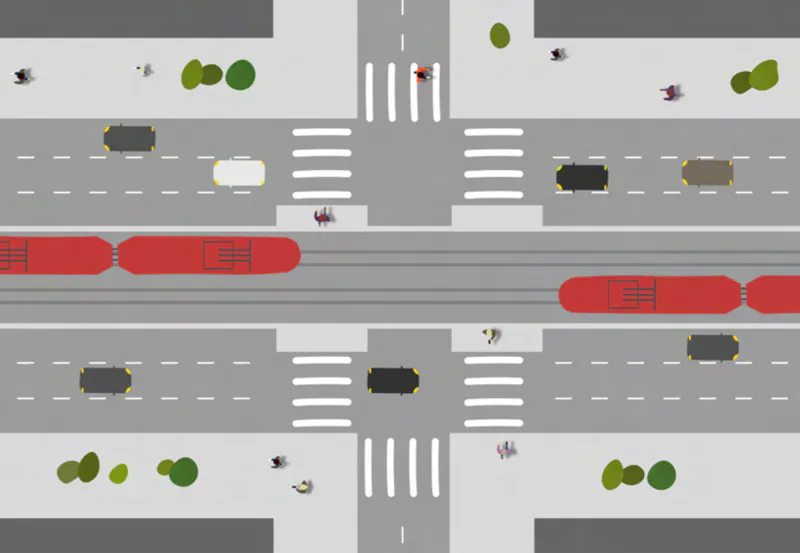
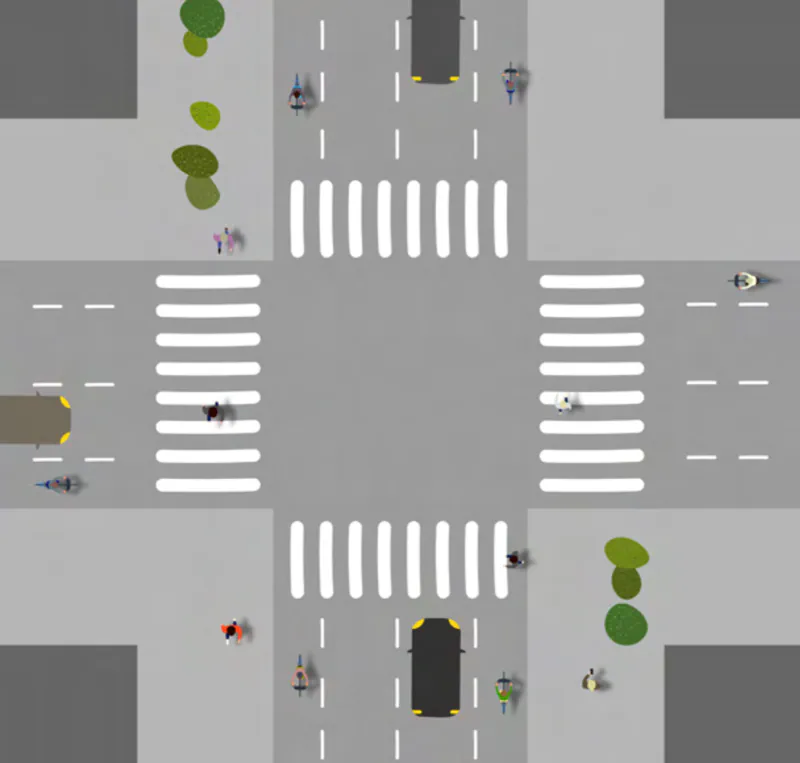
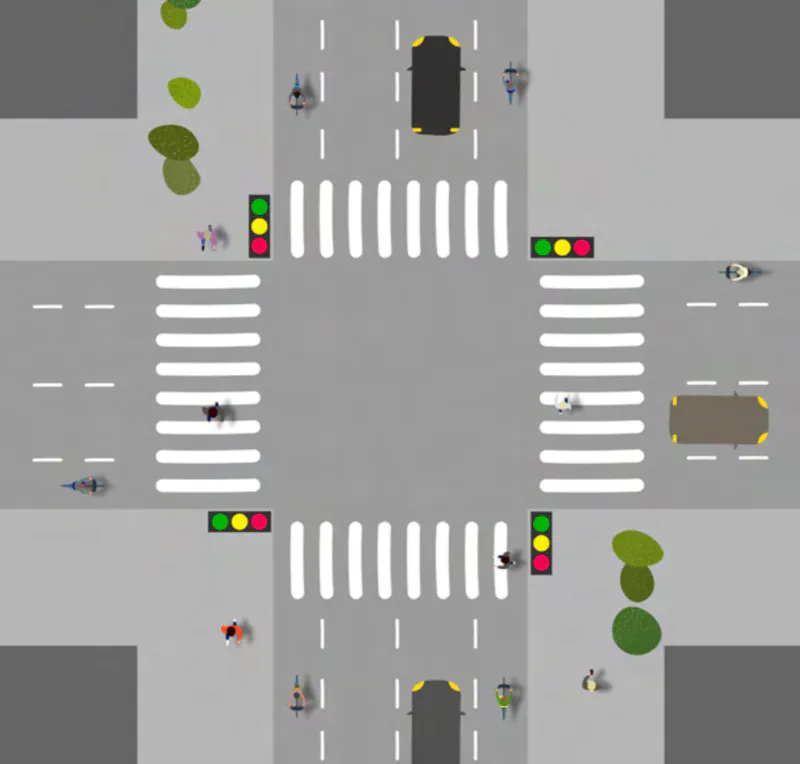
The infographics below show different types of infrastructure, ranging from the most pedestrian-friendly to the least:

Infographic of an intersection without traffic lights where drivers must yield to pedestrians
No traffic lights: drivers are expected to stop and give way to pedestrians
Diagram of a signalised intersection showing both cars and pedestrians waiting for green
Traffic lights: both cars and pedestrians wait for the green
Diagram of a roundabout designed primarily to keep vehicle traffic moving faster, with limited pedestrian priority
Roundabouts were designed to keep car traffic moving faster
Illustration of bridges and highways cutting through urban areas, showing barriers to walkability
Bridges and highways do not belong inside cities

Unless indicated otherwise, infographics developed by Lucija Gudek

This article was initially published by the Cooperation and Development Network. Read the full publication at https://www.cdnee.org/publications